Intercepting customer attrition 30 days before the cancellation call
In subscription businesses, customer acquisition costs are too high to treat churn as an unpredictable cost of doing business. When 1,732 subscribers walked out the door—representing a 27% attrition rate—leadership needed to know who was leaving, why they left, and who was walking out next.
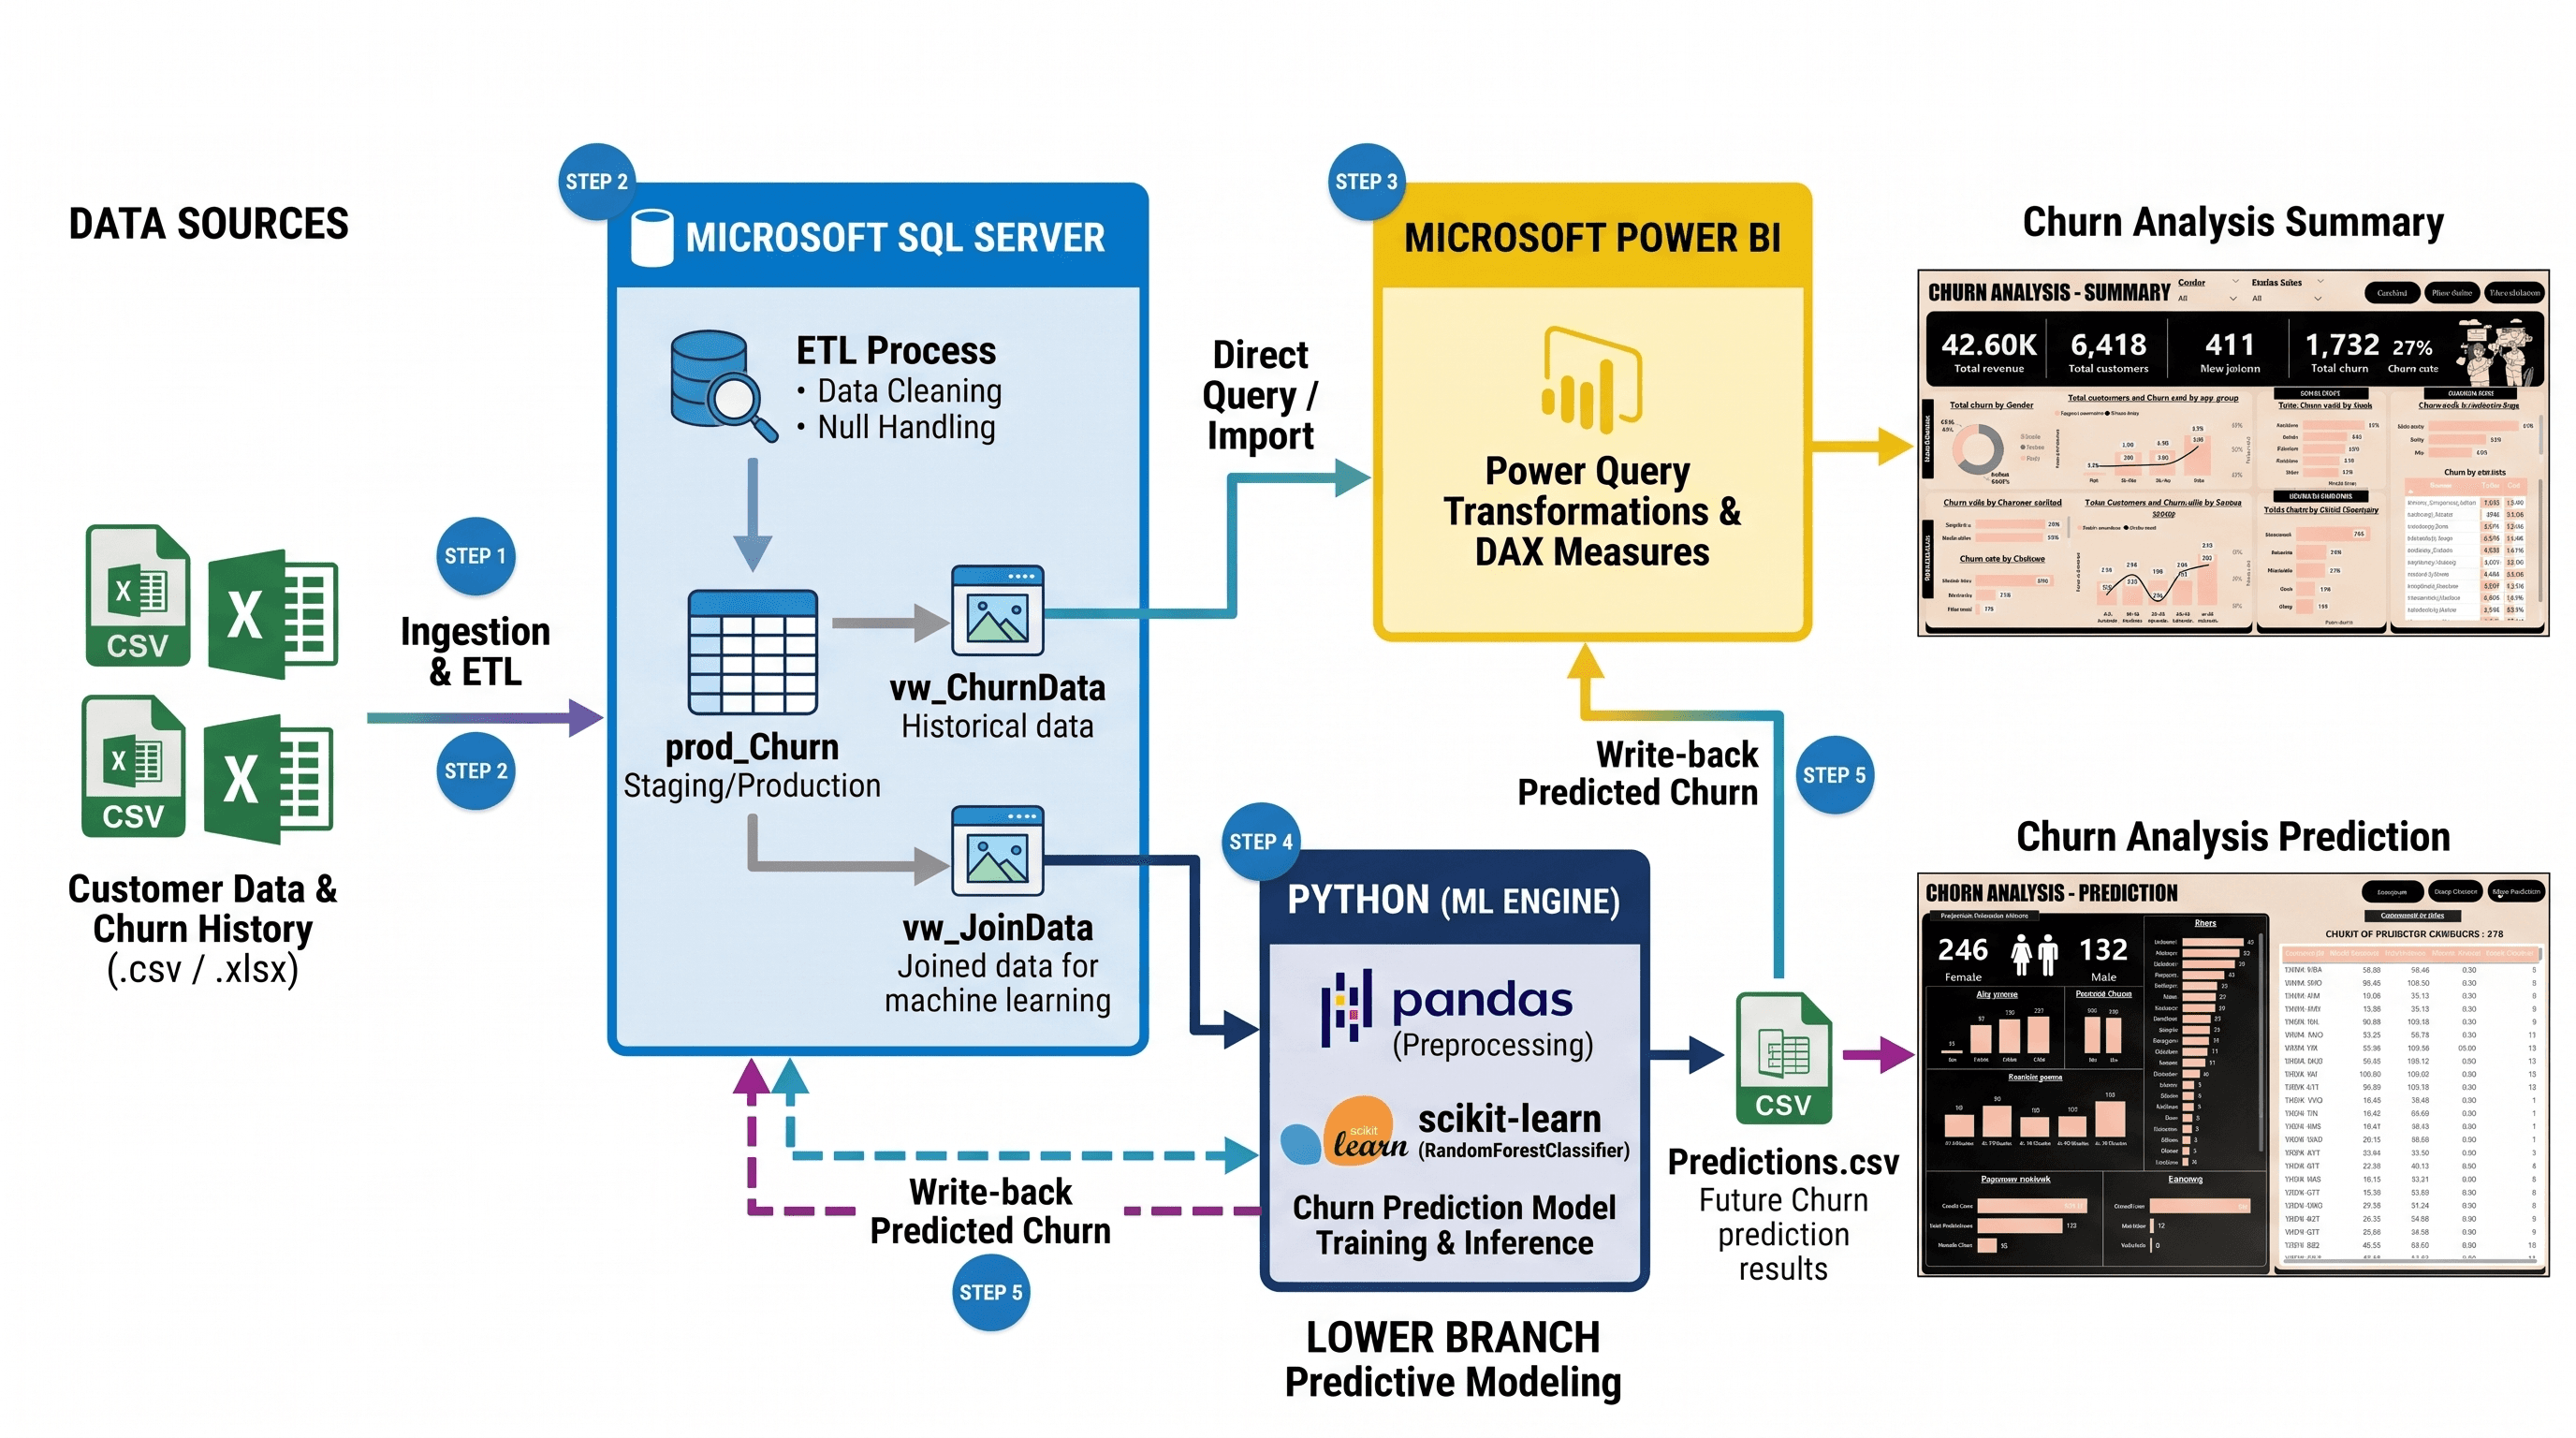
We built a complete, closed-loop retention intelligence platform connecting Microsoft SQL Server data warehouses with machine learning and interactive Power BI executive reporting.
By analyzing 6,418 historical customer accounts, our exploratory SQL procedures isolated the structural root causes of churn: competitor conquesting (761 accounts), customer service friction (301 accounts), and a severe 47% churn cliff on month-to-month contracts.
We then deployed an ensemble Random Forest classifier that evaluated new joiners and active accounts, generating an early-warning list of 378 high-risk subscribers. Loaded directly into Power BI, account executives can filter by state, contract tenure, and monthly revenue to trigger proactive retention offers before accounts churn.
The 27% Attrition Dilemma
Auditing $42.6K in revenue and 1,732 lost customer accounts
Audited a 6,418-customer subscriber base to calculate baseline churn metrics. The baseline revealed an alarming 27% overall attrition rate, establishing the urgent business case for a data-driven customer retention system.

Production SQL Server ETL Pipeline
Staging, sanitization, and structured reporting views
Engineered an automated T-SQL pipeline in Microsoft SQL Server. Cleaned null-value fields across 30+ columns, normalized billing attributes, and deployed production views (`vw_ChurnData`, `vw_JoinData`) to serve as a clean connection layer for Power BI.

Diagnosing the Root Causes of Churn
Exposing the month-to-month contract cliff and competitor pressure
Detailed exploratory analysis revealed that month-to-month subscribers churned at an extreme 47%, compared to just 3% for two-year accounts. Competitor offerings were responsible for 761 departures, while support attitude and service dissatisfaction accounted for an additional 601 lost clients.

Random Forest Predictive Modeling
Scikit-Learn classification across 19 behavioral features
Trained a Random Forest classifier in Python across 19 encoded features including contract length, payment method, internet type, and support plan attachments. The ensemble model evaluated complex non-linear relationships to score the attrition probability of every active account.

The 378 Early-Warning Intervention Radar
Predicting future churners across incoming customer cohorts
Applied the trained model to new joiner cohorts, isolating 378 active accounts with imminent churn trajectories. The output provided demographic, geographic (state-by-state), and revenue exposure breakdowns, allowing retention teams to intervene 30 days prior to contract cancellation.

The Power BI Executive Decision Matrix
Interactive DAX KPIs, demographic slicing, and account action lists
Designed an interactive dual-page executive dashboard in Power BI. Features custom DAX measures for churn rates, demographic cross-filtering, and an actionable 'Customers at Risk' table displaying Customer IDs, monthly charges, and referral counts for immediate operational outreach.
378 Accounts
Random Forest classifier flagged 378 high-probability churners with full demographic and contract breakdowns.
47% vs. 3%
Uncovered that month-to-month subscribers churned at 47%, compared to just 3% for two-year contract accounts.
761 Churners
Quantified that 44% of lost customers left due to rival competitor pricing and service packages.
What did I learn?
Predictive models must generate lead time, not historical post-mortems.
Calculating why an account cancelled yesterday provides zero financial recovery. Outputting calibrated risk probabilities 30 days before contract expiry gives customer success teams the runway needed to offer customized renewals.
Contract architecture dictates customer retention more than demographics.
While demographic breakdowns showed higher attrition among senior subscribers, contract type was the overwhelming driver: month-to-month contracts had a 47% churn rate, proving that annual packaging is the single most effective hedge against customer loss.
Analytical models are useless without an executive interface.
Machine learning predictions stored in CSV files rarely change operational behavior. Feeding raw Scikit-Learn inference arrays into interactive Power BI tables equipped account managers with immediate, actionable customer call lists.